
SPIA Payout Index
What $100,000 buys in guaranteed monthly income for life at 65, starting from quotes our agent runs for real clients. October 2026: $693/month for a 65-year-old man, unchanged from September 2026 and +2.7% since August 2026, the first month built from real quotes.
Latest reading, : $693 a month per $100,000 for a 65-year-old man. The man 65 figure is read at a surveyed age in an earlier round, then repriced. The woman 65 figure is derived from each carrier's own ratio to its men's quote at surveyed ages, then repriced. The couple 65 figure is derived by ratio, then calibrated to a direct same-age joint quote (both spouses 66) from the latest round. The man 70 and man 75 figures are interpolated between surveyed ages in an earlier round, then repriced. None of these figures is a direct quote from the latest survey round.
Index value · man, age 65
$693/mo per $100,000
≈ 8.3% of premium paid out per year, for life
Surveyed age, repriced
Woman, 65
$658/mo
From carrier ratios, repriced
Couple, 65 (100% to survivor)
$608/mo
From carrier ratios, calibrated to a joint quote
Man, 70 / 75
$767 / $893/mo
Interpolated, repriced
| Month | Man 65 | Woman 65 | Couple 65 | Man 70 | Man 75 | Basis |
|---|---|---|---|---|---|---|
| March 2026 | $618 | $585 | $542 | $698 | $808 | Earlier estimate, life-only basis |
| May 2026 | $632 | $598 | $555 | $712 | $825 | Earlier estimate, life-only basis |
| July 2026 | $664 | $635 | $583 | $754 | $882 | Earlier estimate, life-only basis |
| August 2026 | $675 | $637 | $587 | $751 | $873 | Built from real quotes, 5-year certain |
| Note for August 2026: From August 2026, figures come from actual carrier quote surveys (single life, 5-year period certain). Earlier months were market-survey estimates on a life-only basis, so the July→August change is partly a change in basis rather than a market move. | ||||||
| September 2026 as of | $693 | $658 | $598 | $767 | $893 | Built from real quotes, 5-year certain |
| Revisions in September 2026 (man 65):
| ||||||
| October 2026 as of | $693 | $658 | $608 | $767 | $893 | Built from real quotes, 5-year certain |
| Note for October 2026: The couple figure was calibrated this month to a direct same-age joint quote (both spouses 66), put on a $100,000 basis. On the same footing, September's couple figure would have been about $608, so the change from $598 is a correction to our estimate, not a market move. | ||||||
Rows marked "Earlier estimate, life-only basis" (March 2026, May 2026 and July 2026) are not like-for-like with the months built from real quotes, which start at August 2026. We show change only since August 2026. "Built from real quotes, 5-year certain" does not mean every figure in the row is a direct quote: the cards above and the methodology below say how each one is built.
Download: CSV · JSON · Chart (SVG) · Licence: CC BY 4.0
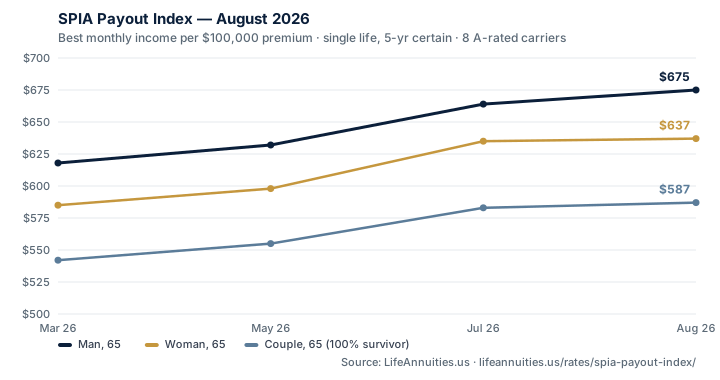
Source: LifeAnnuities.us quote surveys run for real clients. The figures start from quotes our agent runs for real clients, not advertised rates or illustrations. For the base tables we received 54 survey runs covering 30 client scenarios, prepared July 14 to September 14, 2026, and used 52 of them for pricing (2 runs used annual payments and were left out of pricing). 17 carriers were quoted. On we checked the tables against 7 new survey runs (4 client scenarios, prepared September 18 to 29, 2026). 11 runs were received and 4 were not used (4 runs were for a 41-year-old, well below our table ages; two of them were at $5,000,000). We repriced 1 of the 8 carriers we publish (Athene, up about 1.8%) and held the other 7 at their earlier figures. A repriced carrier has its whole table moved by its own measured change on quotes for the same age and sex. New York Life: readings were mixed, so we held its figures until the next round. Two direct comparisons with mid-September quotes came in 0.7% and 1.6% higher once premium size is allowed for. A third, measured through August, came in 0.6% lower. How each figure is built. Men: 60, 65 and 80 read at surveyed ages; 55, 70 and 75 interpolated between surveyed ages. Women: all ages derived by ratio. Joint: 55, 60, 75 and 80 derived by ratio; 65 and 70 calibrated to a direct same-age joint quote. None of the figures in our tables is a direct quote from the latest survey round. They are built from earlier rounds (read at surveyed ages, interpolated or derived from carrier ratios) and checked carrier by carrier against the latest one. Joint figures at ages 65 and 70 are calibrated to a direct joint quote (same-age joint quote, both spouses 66, 100% to the survivor, 5-year period certain, prepared September 18, 2026). That corrects an estimate. It is not a market move. Basis: single life or joint (100% to survivor), 5-year period certain, income starting next month, per $100,000. Full method and known limits. Free to cite with attribution to LifeAnnuities.us.
Cite or embed the index, free
Journalists, advisors and bloggers may republish the index with attribution to LifeAnnuities.us and a link to this page. The data is licensed under Creative Commons Attribution 4.0 International (CC BY 4.0). Copy either block below. The chart image updates on its own when we publish new figures.
Suggested citation
LifeAnnuities.us SPIA Payout Index, October 2026 (as of October 1, 2026): a $100,000 immediate annuity pays a 65-year-old man up to $693/month for life (single life, 5-year period certain; surveyed age, repriced), $658/month for a woman (from carrier ratios, repriced) and $608/month for a couple with 100% to the survivor (from carrier ratios, calibrated to a joint quote). https://lifeannuities.us/rates/spia-payout-index/ Licence: CC BY 4.0.
Embed the live chart
<a href="https://lifeannuities.us/rates/spia-payout-index/" title="SPIA Payout Index, LifeAnnuities.us"><img src="https://lifeannuities.us/embed/spia-payout-index.svg" alt="SPIA Payout Index: best monthly income per $100,000 immediate annuity, October 2026, LifeAnnuities.us" width="720" height="380" style="max-width:100%;height:auto;border:1px solid #e5e9ee;border-radius:8px" loading="lazy"></a>
<p style="font-size:12px;color:#5b6976">Source: <a href="https://lifeannuities.us/rates/spia-payout-index/">SPIA Payout Index</a>, LifeAnnuities.us. Licence: <a href="https://creativecommons.org/licenses/by/4.0/">CC BY 4.0</a>.</p>
Renders as a 720×380 image linking back here. No scripts, no cookies.
Methodology
The full method, with its known limits, is on the methodology page. The short version:
- What it measures: the best monthly income per $100,000 single premium at age 65 (man, woman and couple) and at ages 70 and 75 (man), among the 8 US insurers we publish, each rated A or better by AM Best: New York Life, Nationwide, Western & Southern, Athene, Penn Mutual, Pacific Life, Mutual of Omaha, Lincoln Financial.
- Contract basis: Monthly income per $100,000 single premium; single life (or joint life, 100% to survivor, both spouses the same age) with a 5-year period certain; income starting one month after purchase; IRA and non-qualified quotes pooled. Our tables are built on quotes with a 5-year period certain, and every joint figure pays 100% to the survivor. Life-only quotes pay slightly more and cash-refund options slightly less.
- Source: quotes our agent runs for real clients through the quoting platform licensed agents use. The survey runs are carrier quotes, not advertised rates or illustrations. Not every published figure is a direct quote: see how each index figure is built, below.
- Base survey rounds: 54 survey runs received, 52 used for pricing, covering 30 client scenarios, prepared July 14 to September 14, 2026. 17 carriers quoted, 18 states, ages of the first-named buyer 49 to 85. Of the 54 runs received, 22 were IRA-funded and 32 non-qualified.
- Latest survey round: 7 survey runs used, covering 4 client scenarios, prepared September 18 to 29, 2026. 17 carriers quoted, 4 states, ages of the first-named buyer 52 to 66, 2 runs IRA-funded and 5 non-qualified. On we checked the tables against these runs: a repriced carrier's table moves by its own measured change on quotes for the same age and sex, and a held carrier keeps the figures it had. 11 runs were received and 4 were not used (4 runs were for a 41-year-old, well below our table ages; two of them were at $5,000,000).
- Carrier moves. Change in each carrier's quote for the same age and sex between the September 16 tables and the late-September round: Athene up about 1.8%; held: New York Life, Nationwide, Western & Southern, Penn Mutual, Pacific Life, Mutual of Omaha and Lincoln Financial. New York Life: readings were mixed, so we held its figures until the next round. Two direct comparisons with mid-September quotes came in 0.7% and 1.6% higher once premium size is allowed for. A third, measured through August, came in 0.6% lower.
- Joint calibration: joint figures at ages 65 and 70 are calibrated to a direct joint quote (same-age joint quote, both spouses 66, 100% to the survivor, 5-year period certain, prepared September 18, 2026). Change per carrier: New York Life +1.6%, Mutual of Omaha +1.4%, Pacific Life +0.8%, Penn Mutual +0.7%; Nationwide, Western & Southern, Athene and Lincoln Financial unchanged. This corrects an estimate. It is not a market move. The quote was for a $250,000 premium and our tables are stated per $100,000, so we first put it on a $100,000 basis using each carrier's own premium-size step, measured on every client quoted at both sizes on the same day (New York Life pays about 0.3% more per $100,000 at $250,000, Western & Southern 0.5%, Penn Mutual 0.3%, Mutual of Omaha 0.4%; the other four pay the same). Changes under half a percent are ignored. Earlier rounds had a same-age joint quote for a couple who were both 57; this is the first one near ages 65 and 70.
- How each index figure is built:
- Man 65: read at a surveyed age in an earlier round, then repriced.
- Woman 65: derived from each carrier's own ratio to its men's quote at surveyed ages, then repriced.
- Couple 65: derived by ratio, then calibrated to a direct same-age joint quote (both spouses 66) from the latest round.
- Man 70 and man 75: interpolated between surveyed ages in an earlier round, then repriced.
- None of these figures is a direct quote from the latest survey round.
- Before August 2026: the March 2026, May 2026 and July 2026 rows are earlier estimates, life-only basis. They were market-survey estimates, so they are not like-for-like with the real-quote months that follow. The chart draws them as dashed lines with a break at August 2026.
- Cadence and revisions: we publish new figures in the first week of each month. When a new survey round later in the month shows carriers have moved, we reprice mid-month. Every revision is dated and stays in the table above. Example: the September 2026 reading was $675 from September 1, 2026 (August round carried forward after a yield check) until it was revised to $693 on September 16, 2026 (Repriced against 17 new survey runs).
- Best-to-lowest spread: in the tables as of October 1, 2026, the gap between the best and the lowest of the 8 published carriers for a man aged 65 on the same contract was about 17%. That gap is why comparing carriers matters.
Questions about the data or a custom cut (other ages, premiums, payout options): contact us. Phil Barker, annuity specialist, (800) 747-4201.
Explore the underlying rates
- Best SPIA rates by age and the full male, female and joint carrier tables
- What a specific premium pays: $100,000 · $250,000 · $500,000
- Payout options (life only, period certain, cash refund) and joint & survivor choices
- Rates by age: 55 · 60 · 65 · 70 · 75 · 80